



Proposal Reports
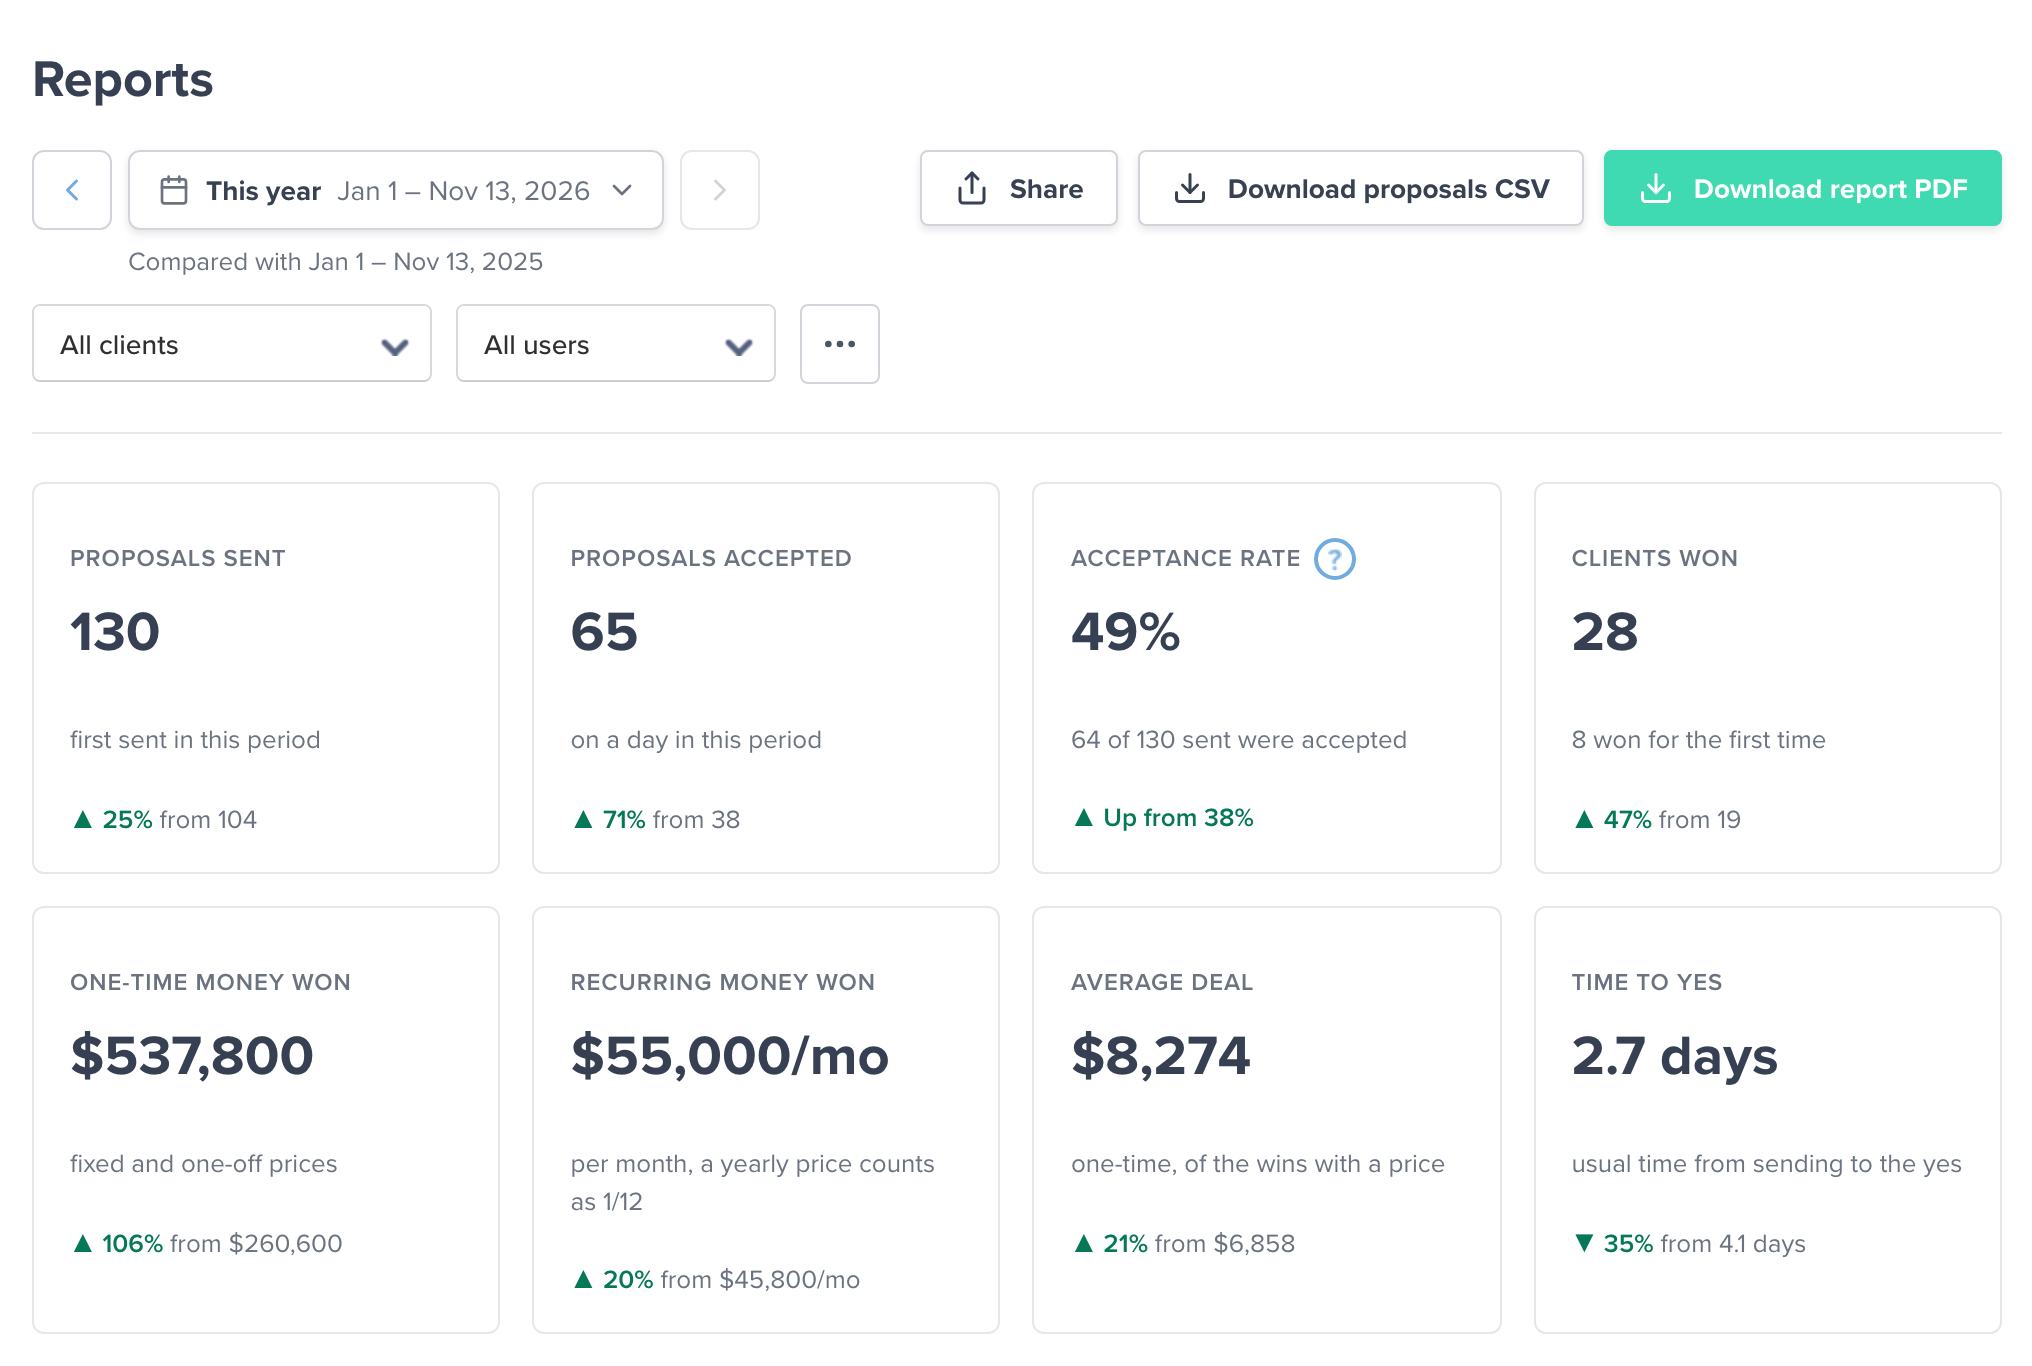
The Reports page shows how your proposals are doing: how many you sent, how many your clients accepted, the money they brought in and how fast clients said yes. Every number is compared with the period before, so you see straight away whether you’re doing better.
Open it from Reports in the main menu.
Choose the period
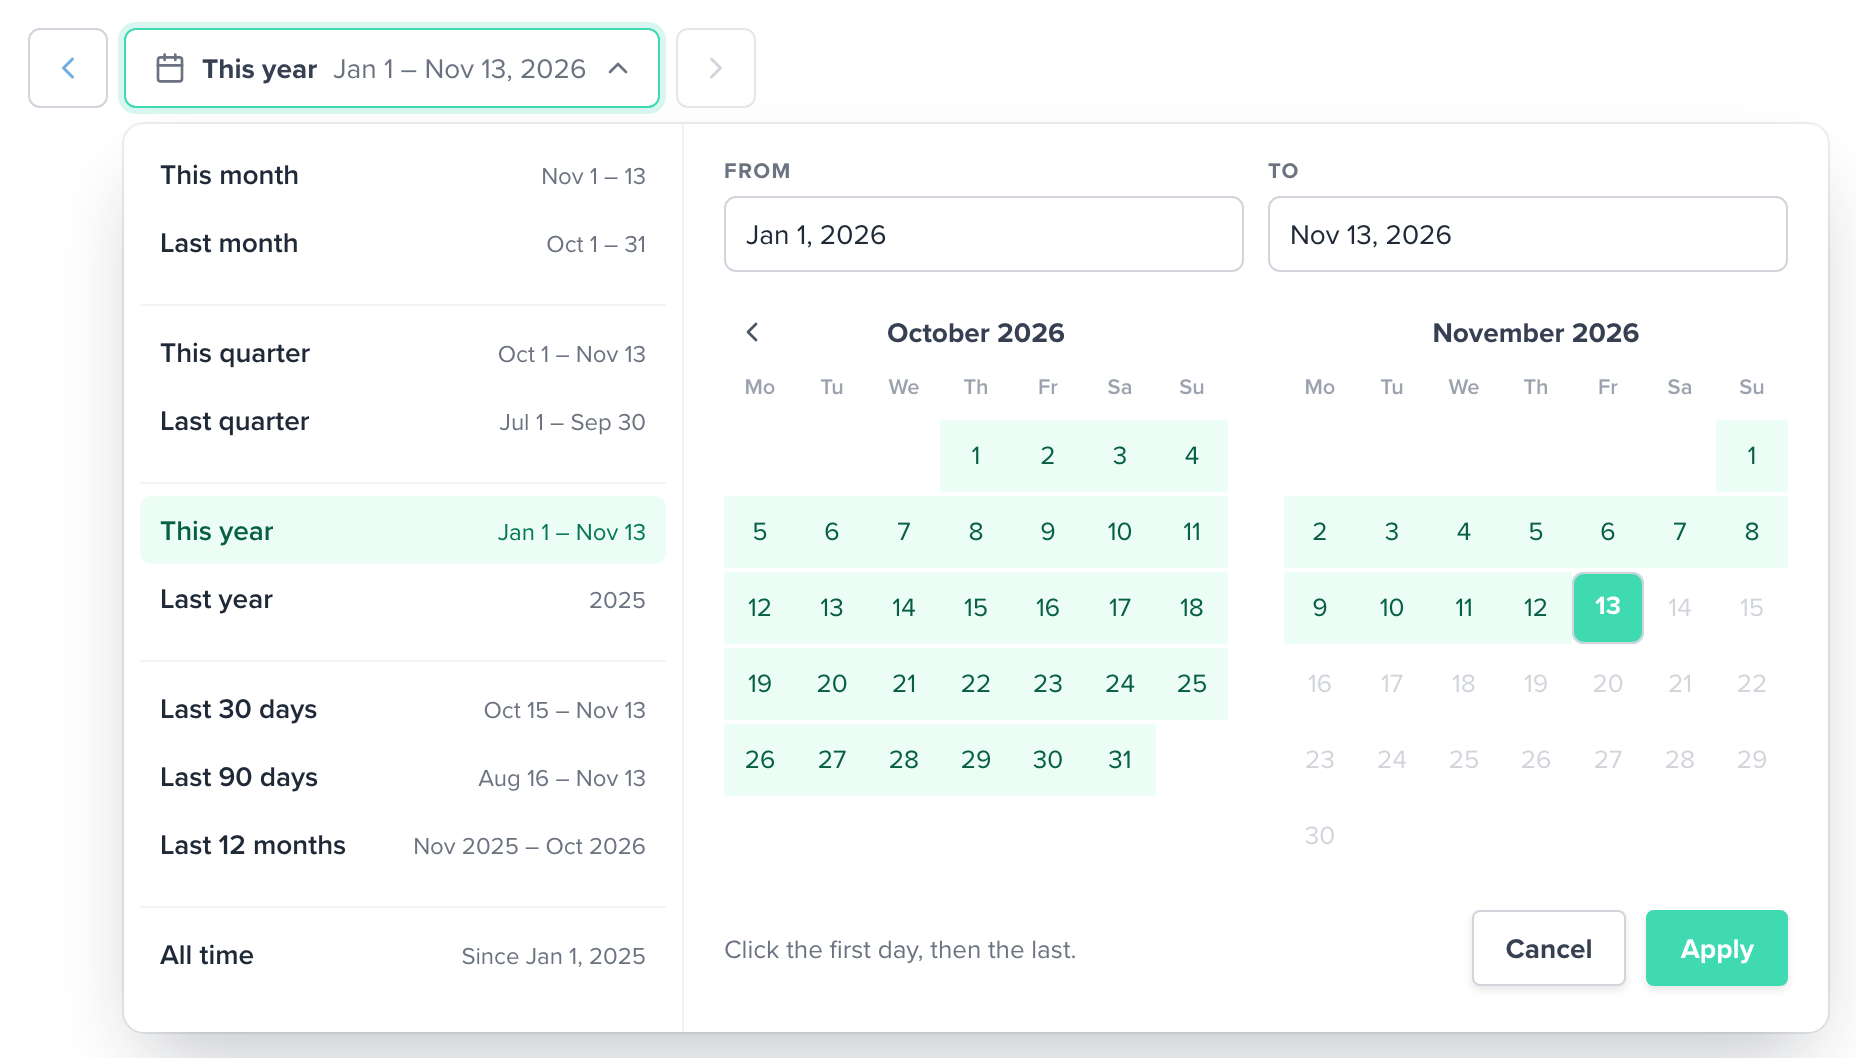
The page opens on This year (in January, on Last year). Click the period to pick another one:
- A preset: this or last month, quarter or year, the last 30 days, 90 days or 12 months, or All time.
- Any two days: click the first day in the calendar, then the last, and click Apply.
The arrows next to the period step to the period before or after it.
Under the period you see what it’s compared with: a month with the month before, a quarter with the quarter before, 30 days with the 30 days before. A period that’s still running, like This year, is compared with the same days of the period before.
Next to the period you can narrow the report to one client or one team member. The More filters button (the three dots) lets you leave out archived proposals.
What the numbers mean
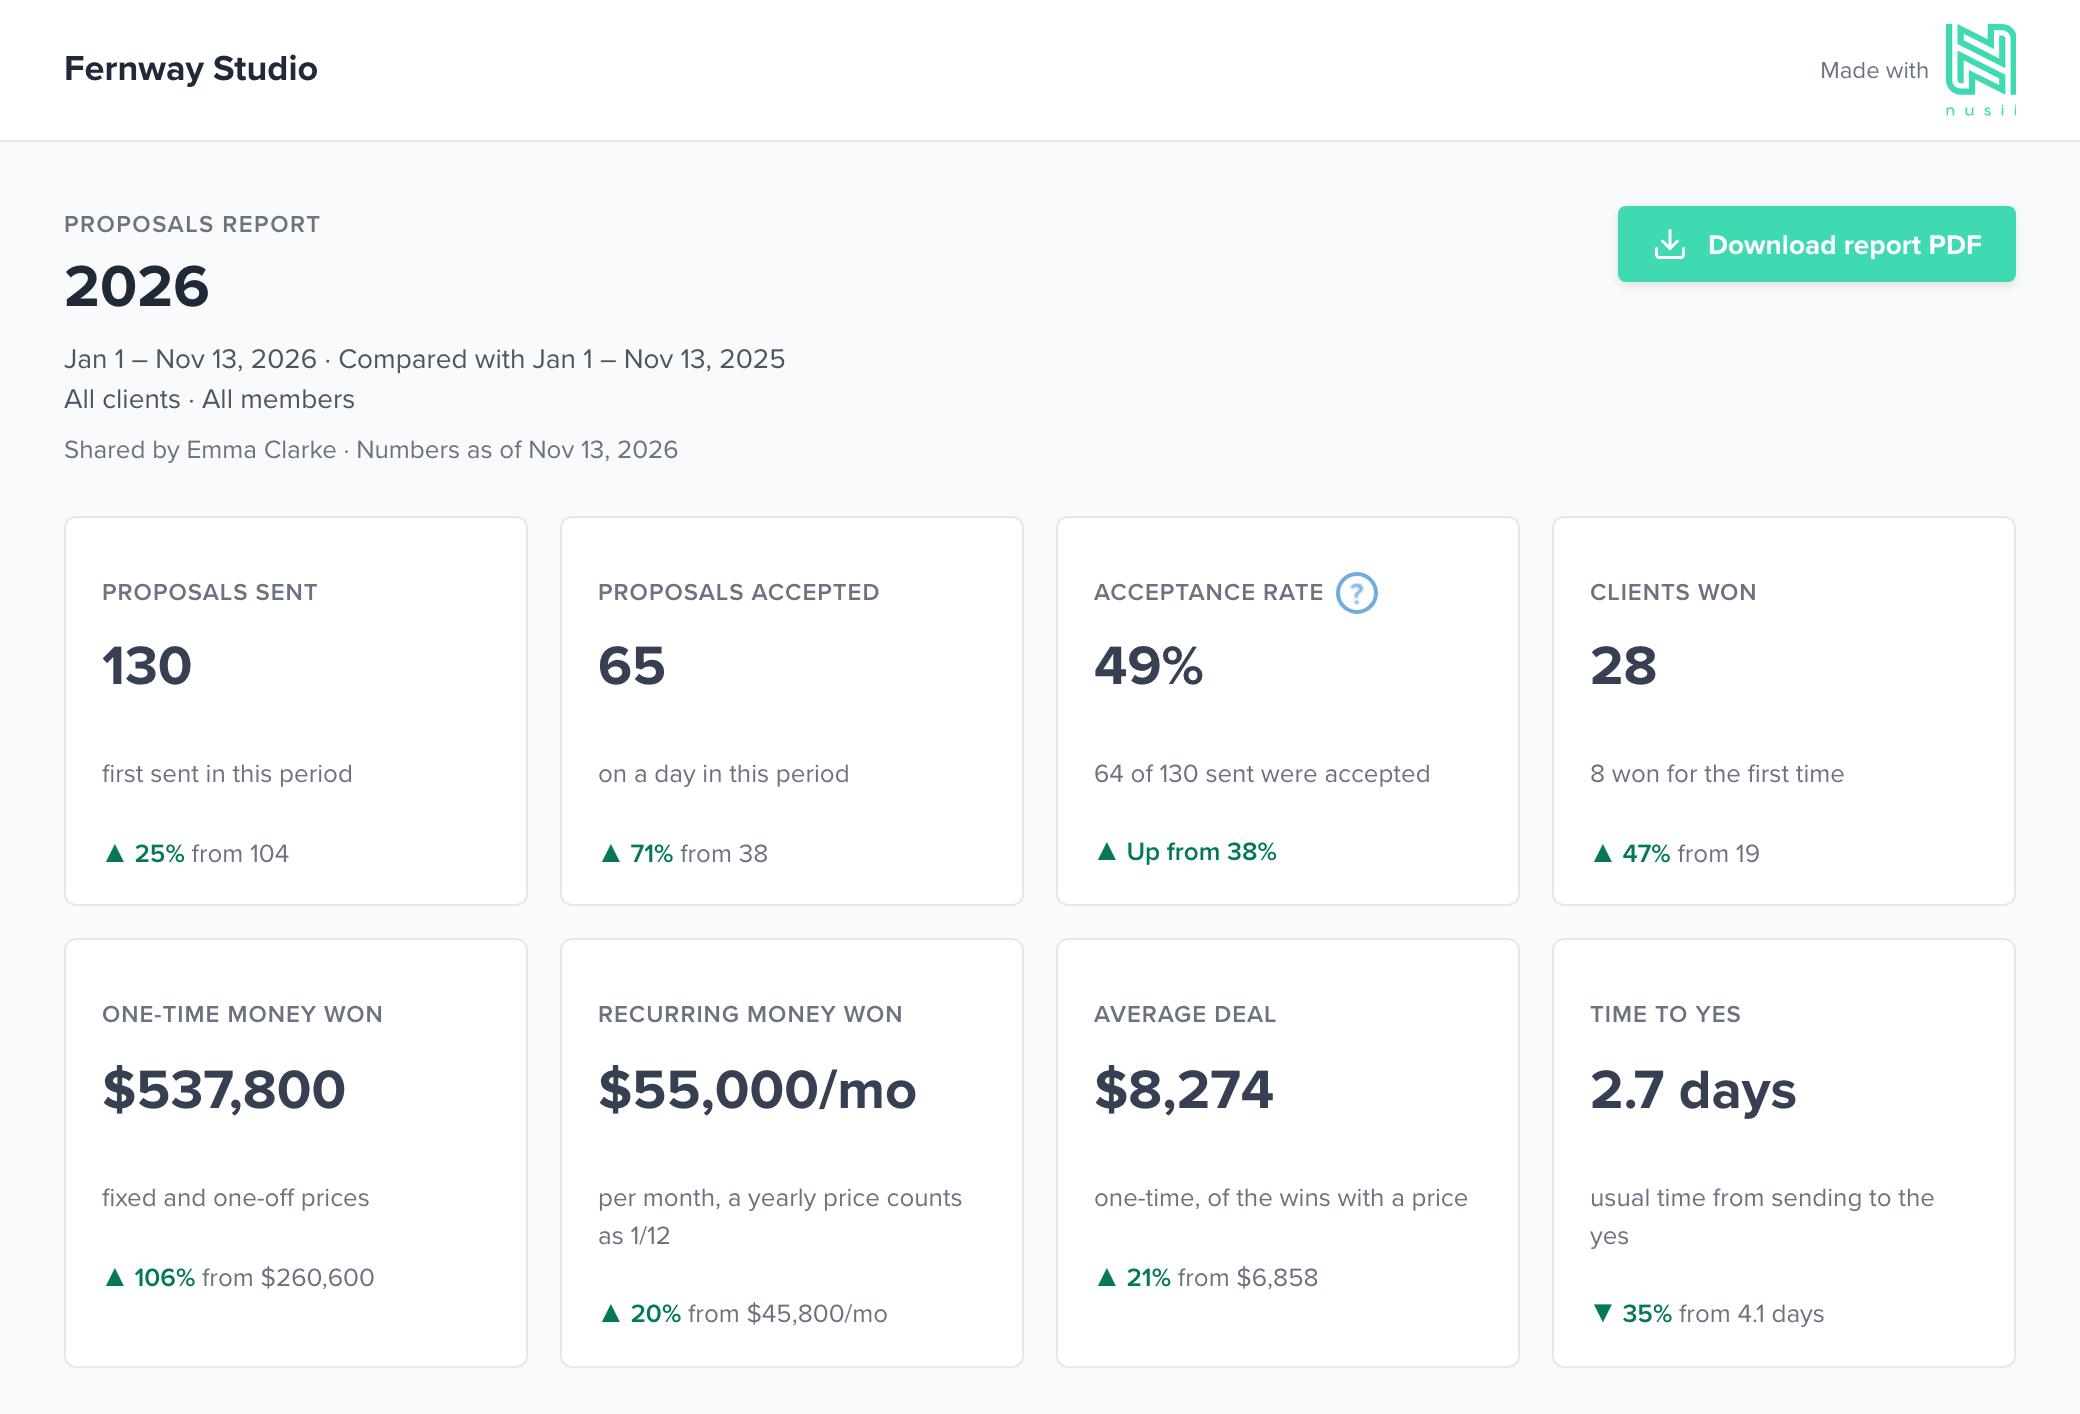
- Proposals sent: the proposals you first sent in the period. If you send a proposal again later, it still counts in the period you first sent it.
- Proposals accepted: the proposals your clients accepted on a day in the period.
- Acceptance rate: of the proposals first sent in the period, the share that’s accepted by now.
- Clients won: the clients who accepted at least one proposal, and how many of them said yes for the first time.
- One-time money won: the fixed and one-off prices of the accepted proposals.
- Recurring money won: the recurring prices of the accepted proposals, per month. A yearly price counts as 1/12.
- Average deal: the average value of an accepted proposal. When most of your wins have a recurring price, it’s a monthly amount.
- Time to yes: the usual time between sending a proposal and the client’s yes.
Each number shows its change against the period before. Hover over a change to see both values. Click Proposals sent, Proposals accepted or Clients won to open exactly those proposals or clients.
The acceptance rate and Proposals accepted count different proposals. A proposal sent in December and accepted in January counts in January’s Proposals accepted, but in December’s acceptance rate.
Test proposals and proposals you send as a report aren’t counted. Neither are proposals to a client with your own company name, as those are usually tests. If you win proposals in more than one currency, Nusii never converts them: the report uses the currency most of your proposals were won in and shows the others next to it.
The charts
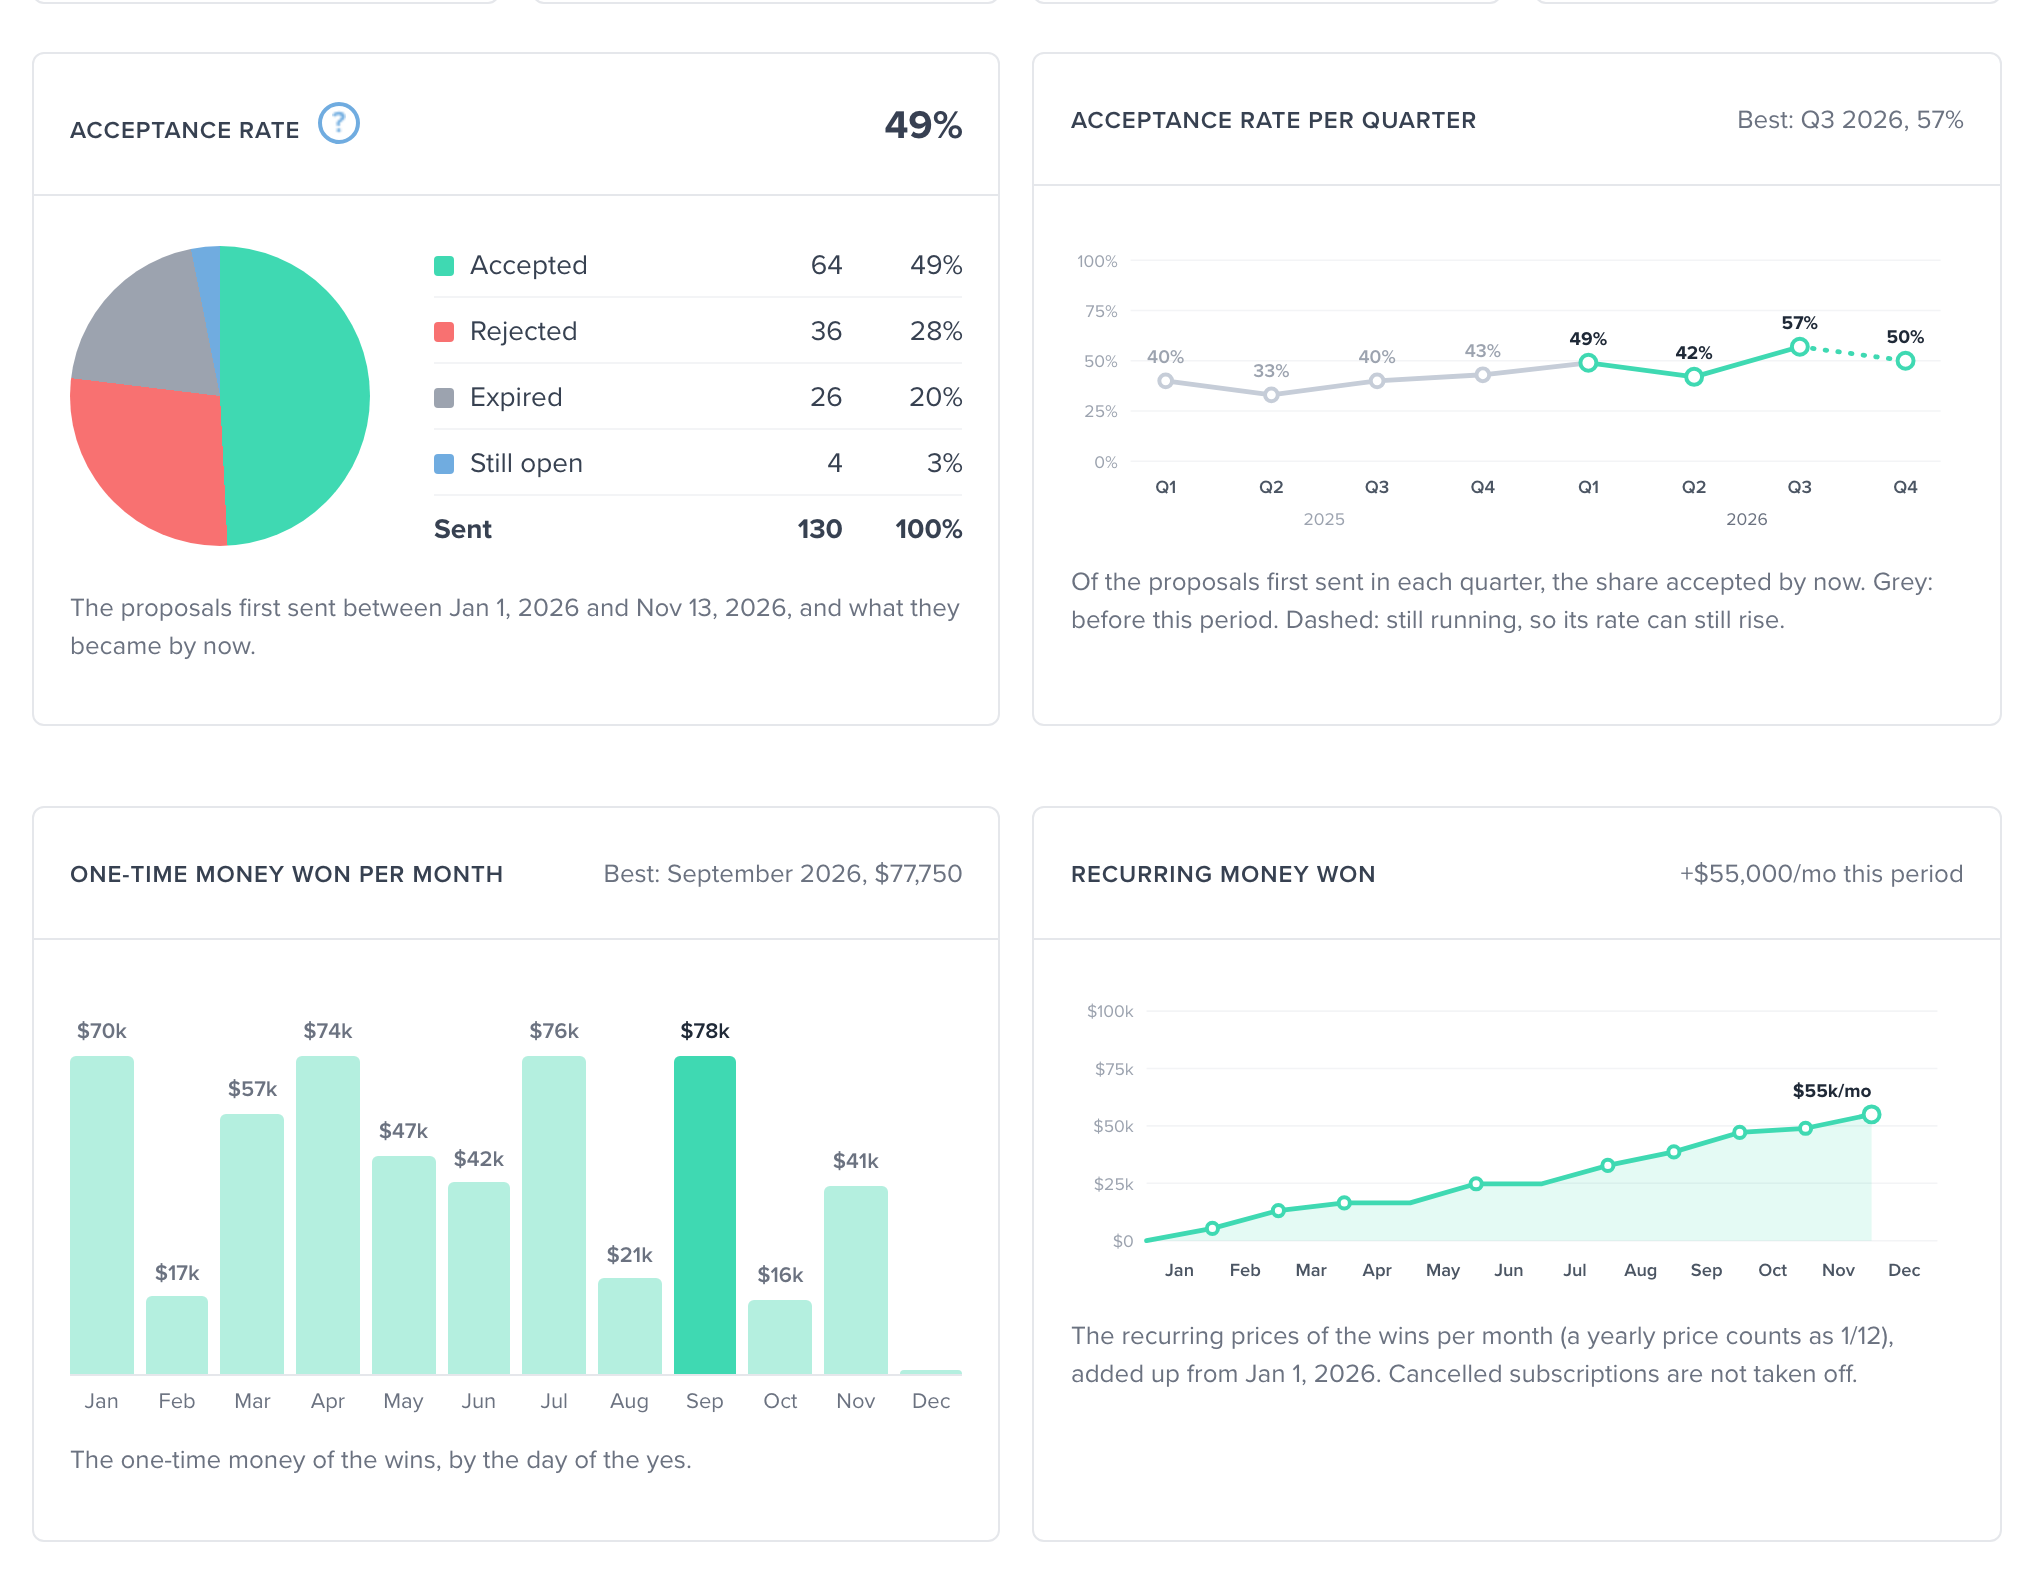
Under the numbers you find four charts:
- Acceptance rate: what became of the proposals sent in the period: accepted, rejected, expired or still open.
- Acceptance rate per quarter: your trend, with the four quarters before the period for context. A dashed line means the quarter is still running, so its rate can still rise.
- One-time money won: per day, week, month, quarter or year, depending on the length of the period, with the best one highlighted.
- Recurring money won: the new monthly revenue from your wins, added up over the period.
Templates
The Templates table shows how each of your templates performs: the proposals sent with it, its acceptance rate, the money it won and its time to yes. Use it to see which templates win the most work.
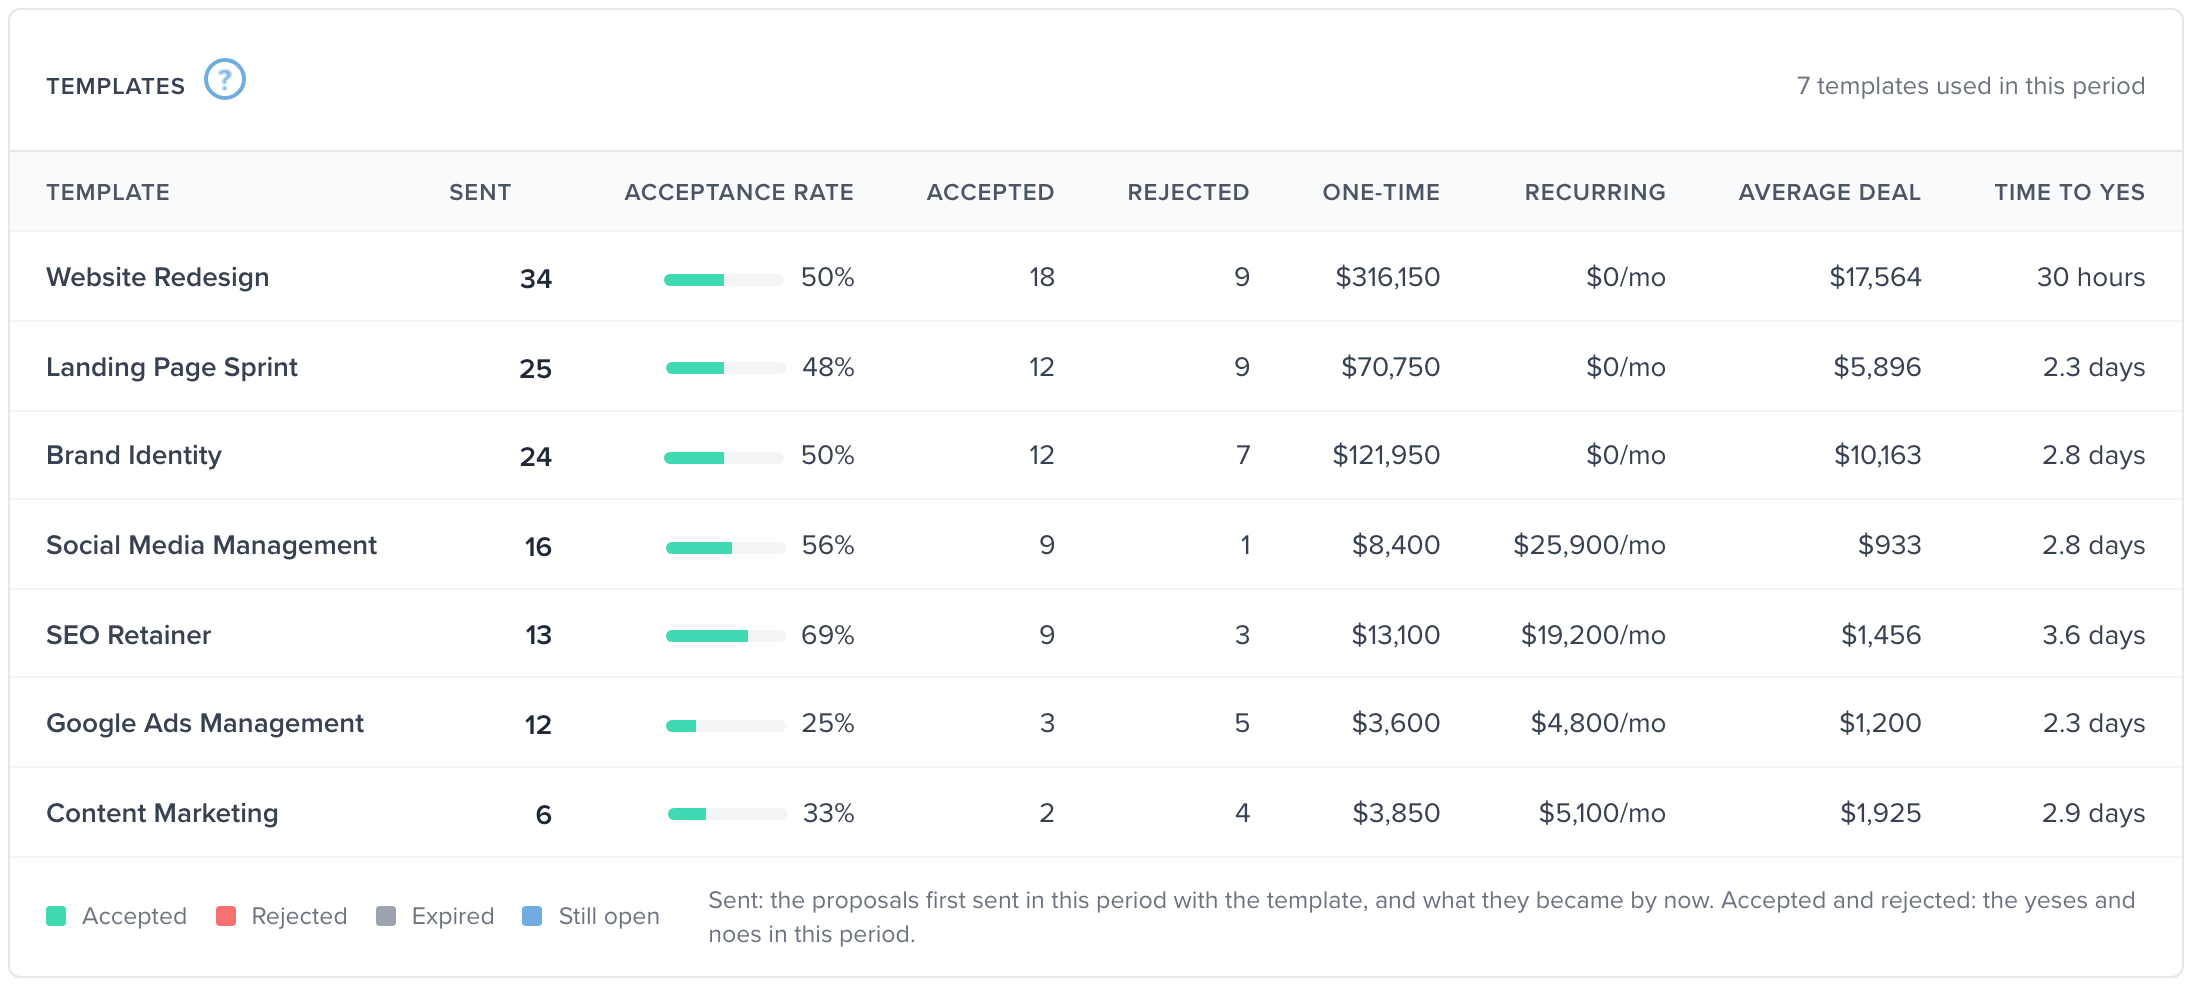
Blank proposals, copies of another proposal and proposals made before July 4, 2026 are listed under No template recorded, because Nusii records the template of a proposal from that day on.
Team
The Team table puts everyone side by side: proposals sent, accepted and rejected, acceptance rate, money won, average deal and time to yes. Click a name to see that person’s report, or a number to open their proposals. A proposal belongs to the team member who created it.
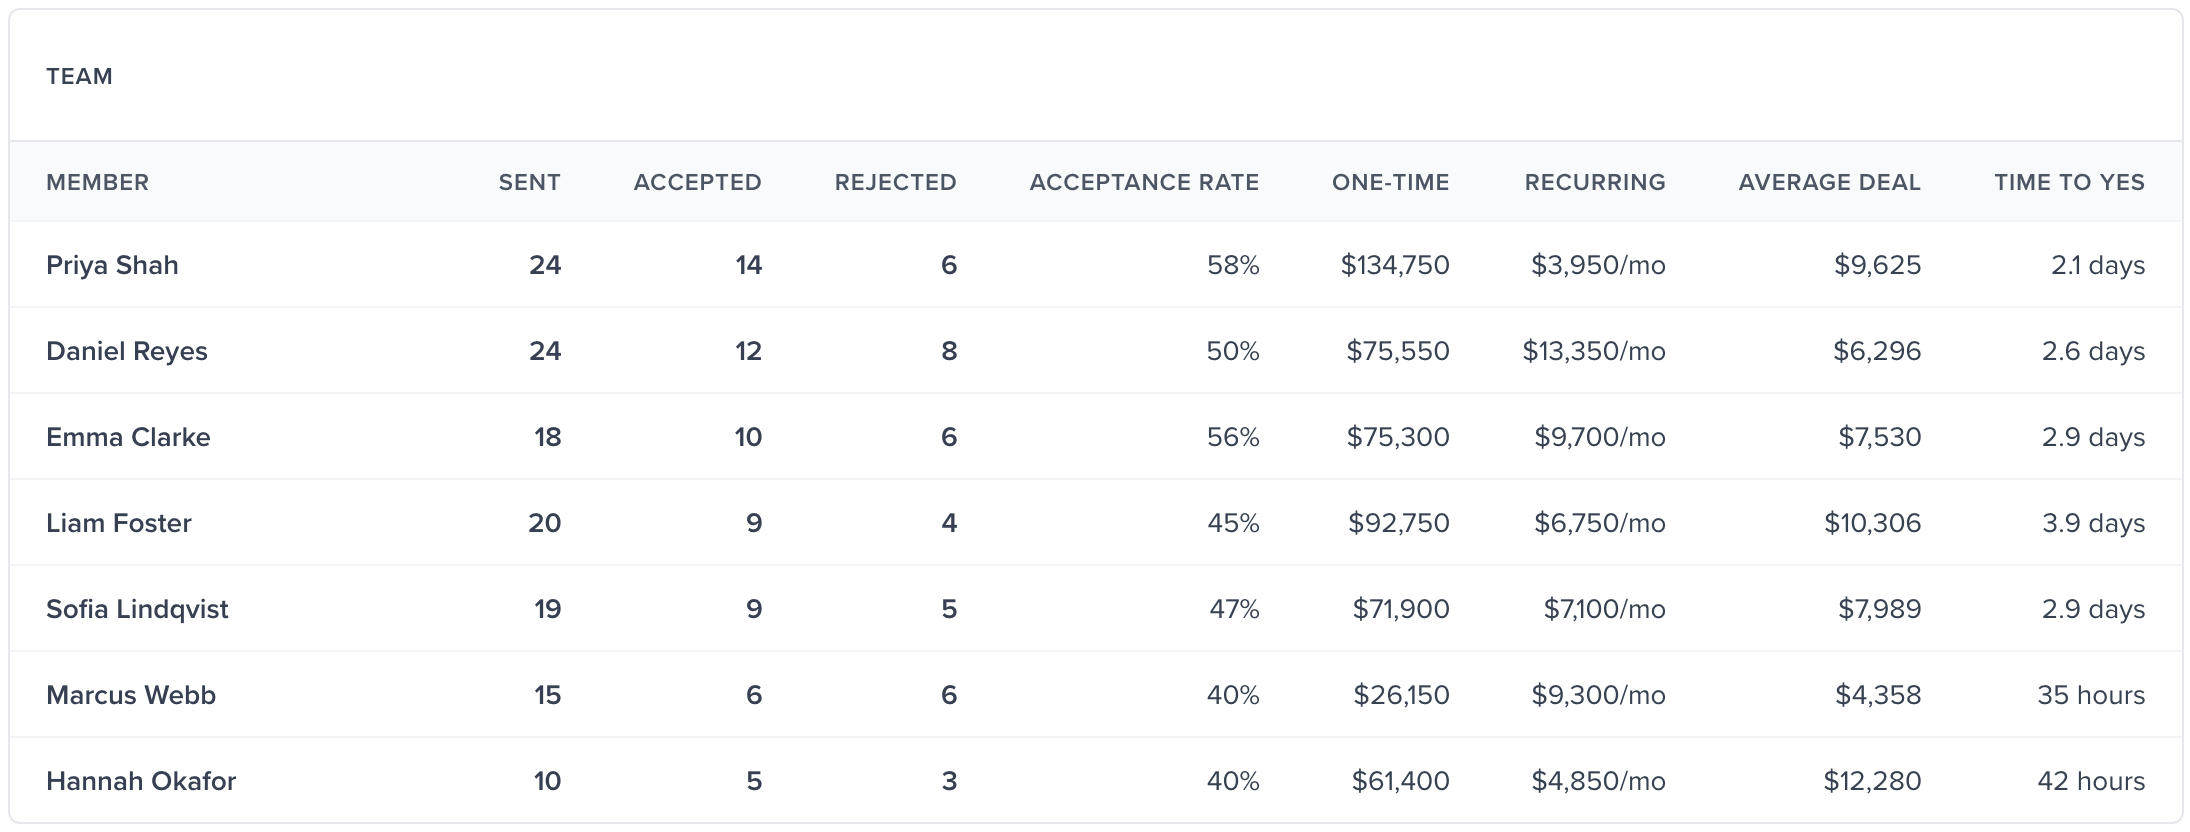
The Team table is part of the Agency and Business plans.
Who sees what
- Owners and administrators see the reports of the whole account, including the Team table.
- Sales members see the report of their own proposals: the ones they created, sent or prepared. They don’t see the numbers of their teammates.
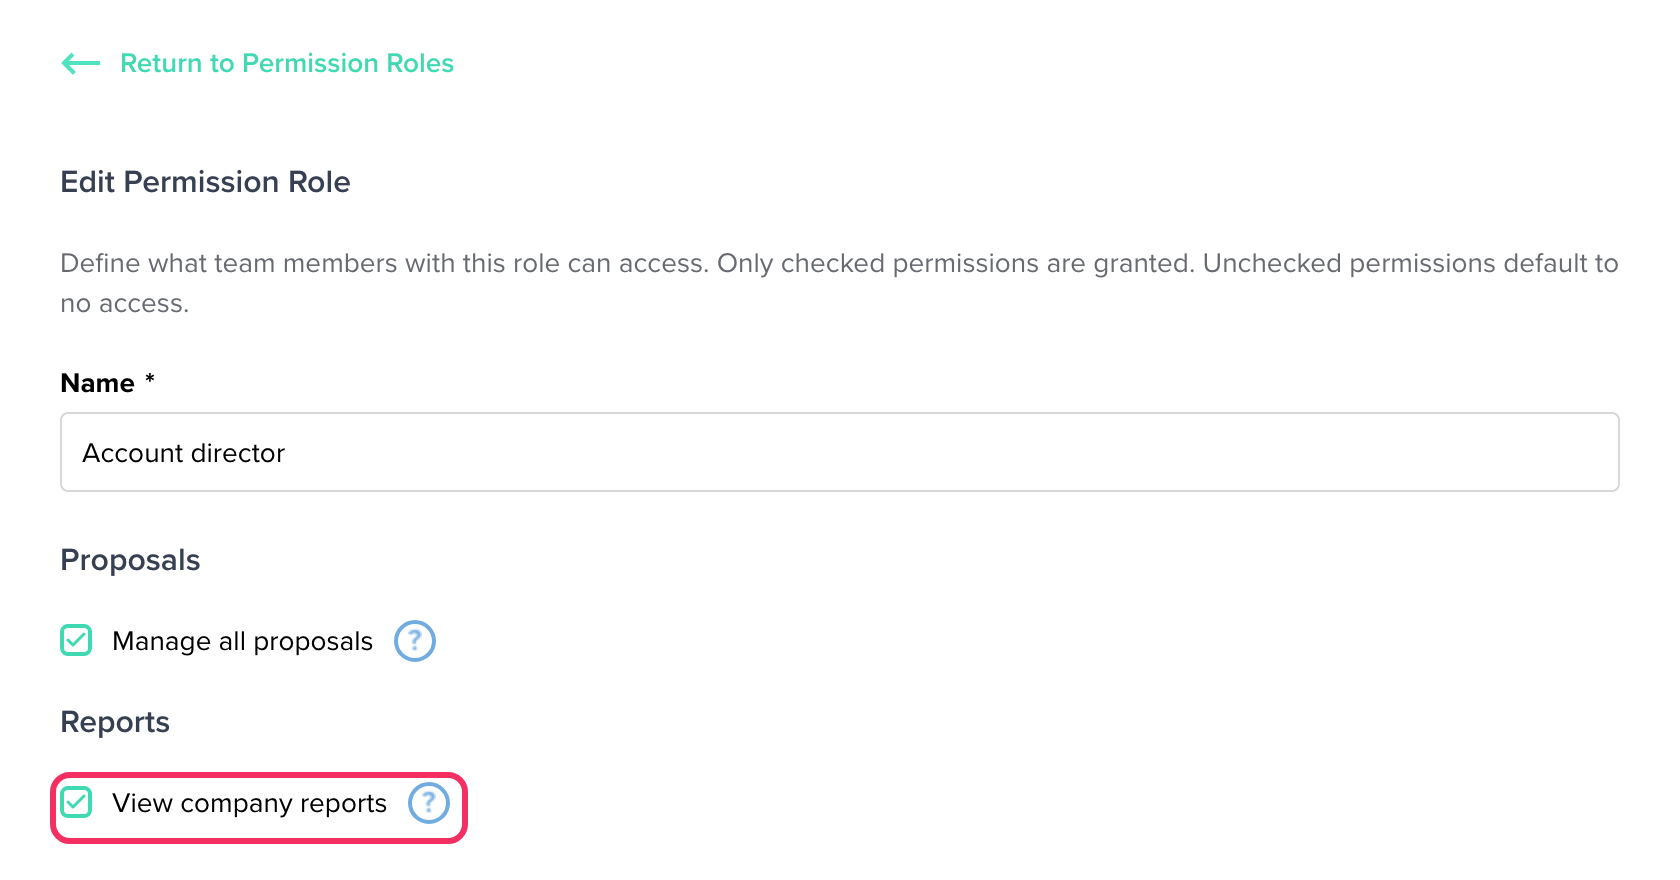
- Custom roles see their own proposals too, unless the role has View company reports. You turn it on in Settings › Permission Roles.
The proposals
At the bottom of the page you find every proposal sent, accepted or rejected in the period, with its team member, status, dates and value. Click Open all in the proposals list to work with them in your proposals list.
Download the report
- Download proposals CSV: the proposals of the report as a spreadsheet, with the client, team member, status, dates, value, recurring price per month and currency.
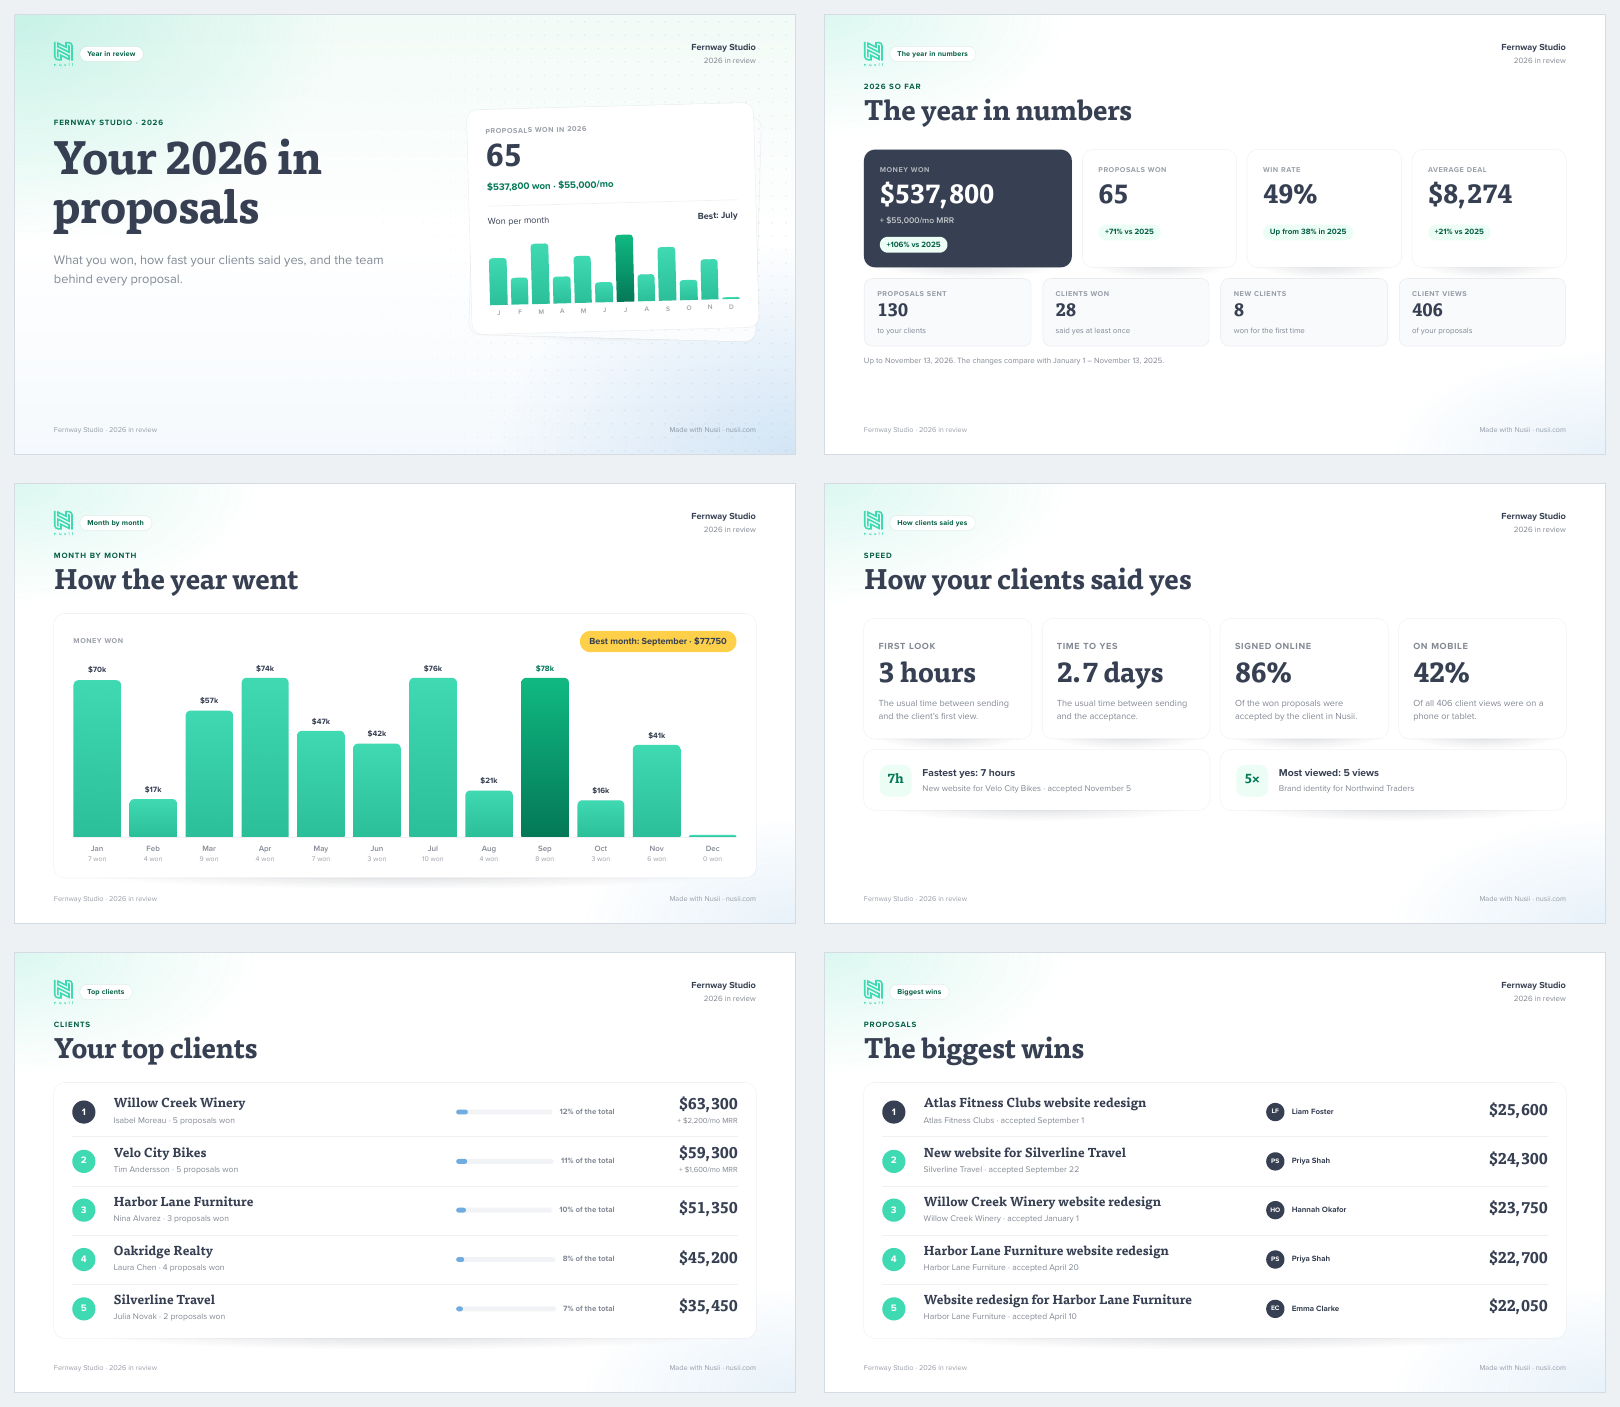
- Download report PDF: the report as presentation slides in your account’s language, ready for a team meeting or a yearly review. It shows your numbers, how the period went month by month, your acceptance rate per quarter, how fast clients said yes, your top clients and your biggest wins. When more than one person sends proposals, it also has a slide about the team. In the slides, the acceptance rate is called the win rate.
Share a report with a link
Want to show your numbers to a business partner, an investor or a client? Share the report with a secret link. Anyone with the link can view the report and download its PDF without a Nusii login. They can’t change the period or open your proposals.
- Choose the period and filters you want to share.
- Click Share.
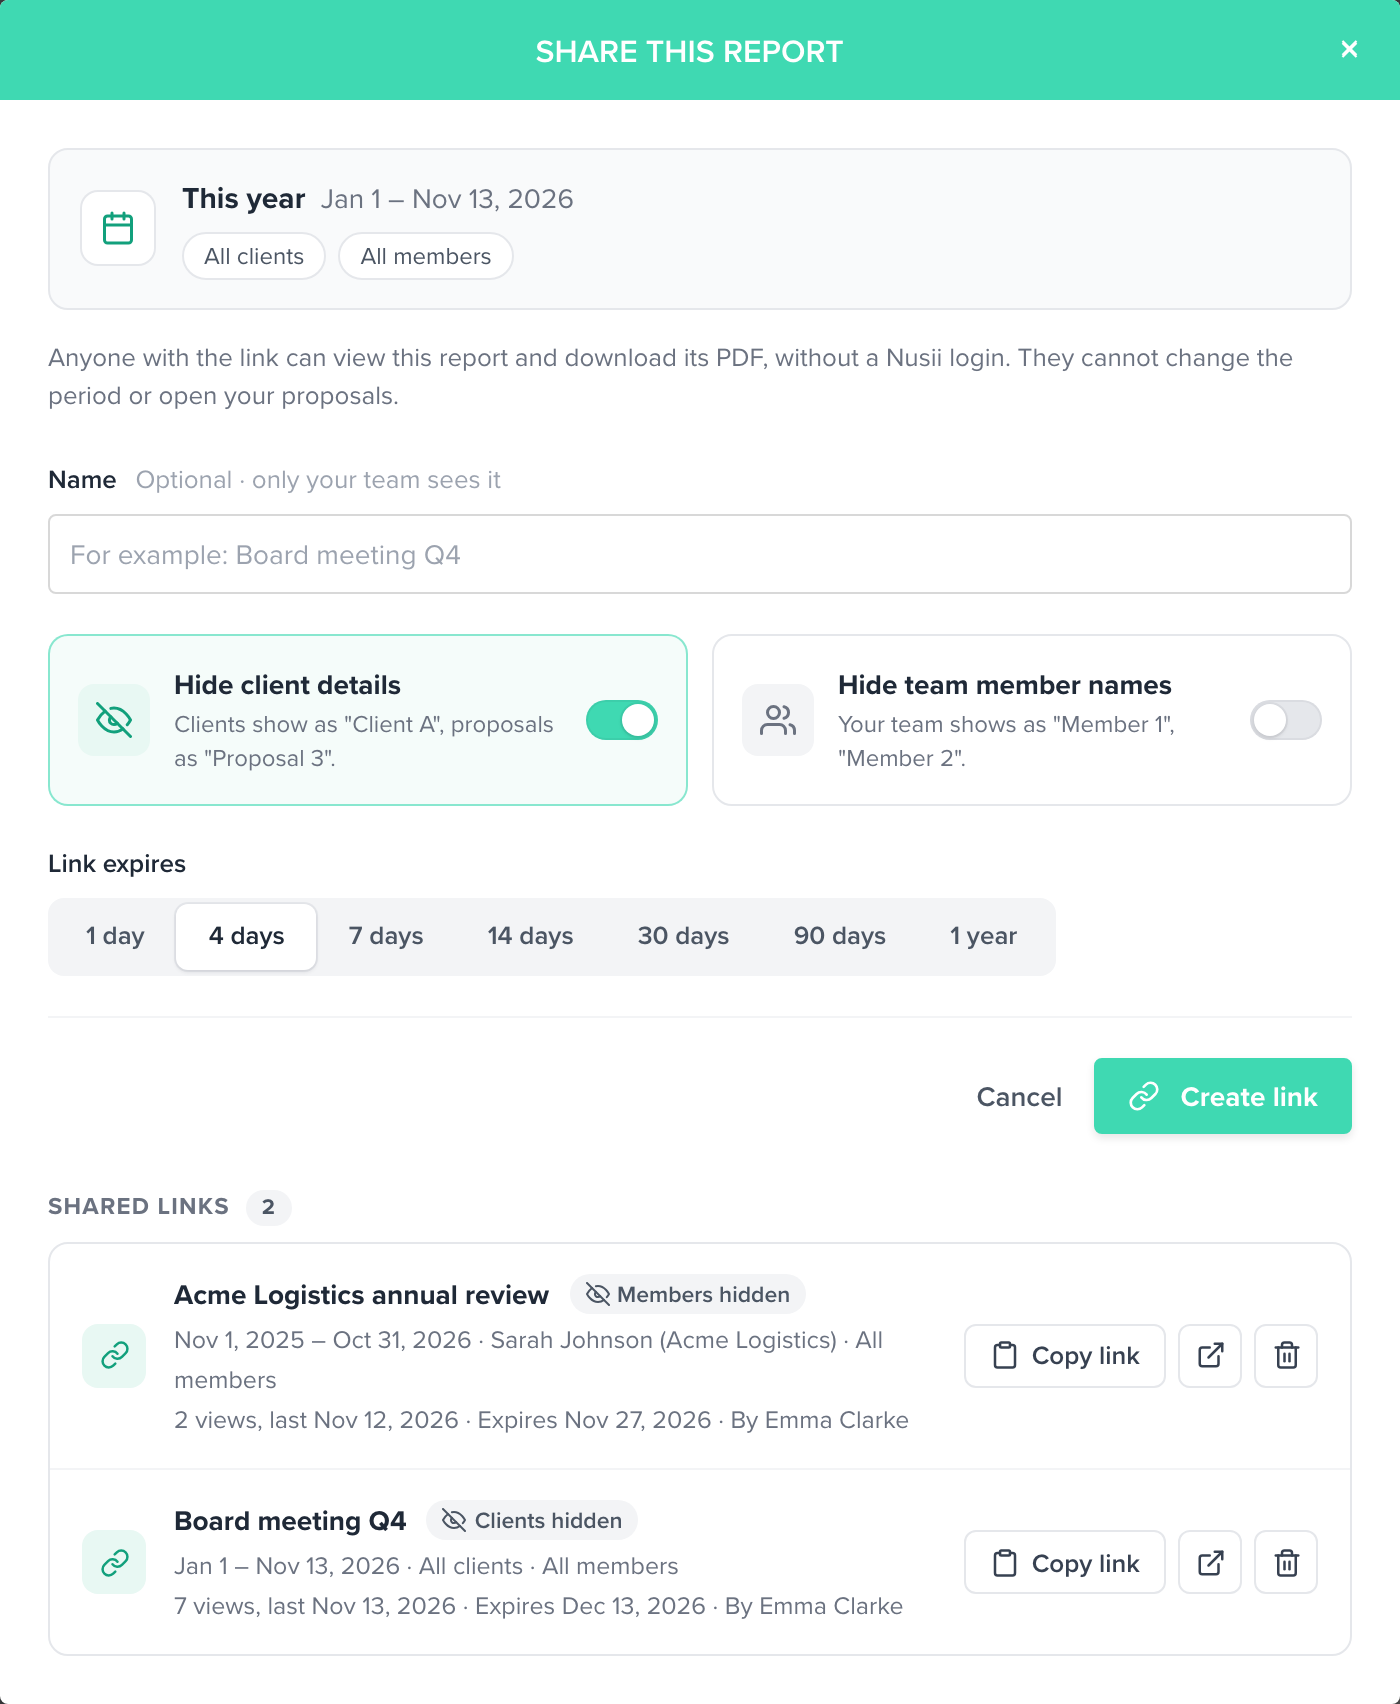
- Give the link a name if you like. Only your team sees it.
- Choose what to hide. Hide client details is on by default: clients show as “Client A” and proposals as “Proposal 3”. Hide team member names shows your team as “Member 1”, “Member 2”.
- Choose when the link expires, from 1 day to 1 year. The default is 4 days.
- Click Create link and copy it.
The link keeps the period and filters you shared, and its numbers stay up to date. The report shows your company name and logo:
Your shared links are listed in the same dialog, with how often each one was opened. Visits from your team don’t count. From there you can copy, open or remove a link. A link stops working when it expires, when you remove it, or when the person who shared it leaves your team or can no longer see the reports.
Ask your AI assistant
If you’ve connected an AI assistant like Claude or ChatGPT to Nusii, it can read the same numbers. Ask it things like “How did this quarter compare with last quarter?” or “Who on the team has the best acceptance rate this year?” It sees what you see on the Reports page.
Related Articles
- Weekly Reports: a summary of your proposals by email every week or month
- How to send a Report: send a read-only document instead of a proposal
- Custom Permissions
- Connect AI Assistants to Nusii
If you have any questions, just ping us below. We’ll be happy to help!